ASP.NET Core 3.1 response time and memory spikes in Kubernetes
Use less memory and handle higher througput in ASP.NET Core


This post is about optimizing throughput for a web application running inside a container in Kuberentes.
Background
If you are like me - having an app runing inside Kubernetes (k8s) - you might also have questions such as "is my app behaving well?". It's impossible to cover everything related to a well performing app, but this post will give you some guidance at least.
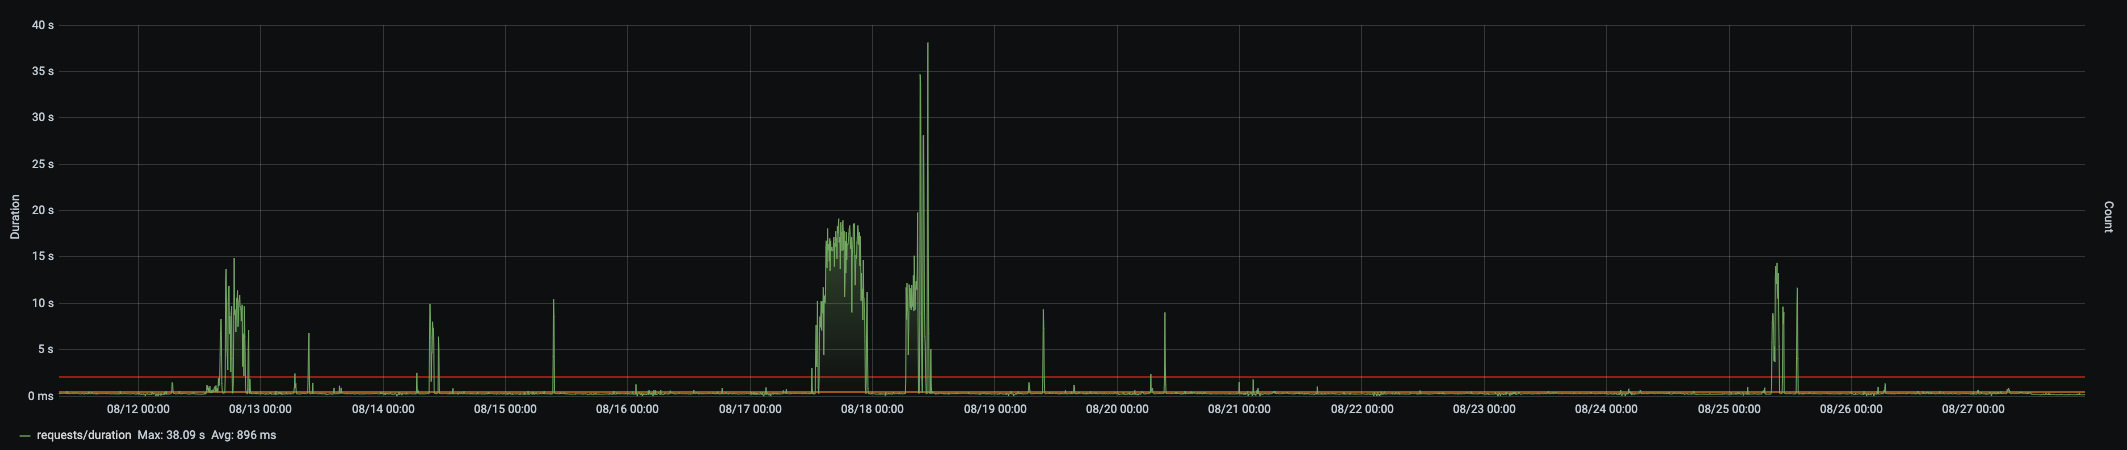
We have an ASP.NET Core 3.1 web application in k8s running with 3 pods in total. Normally each pod have had a memory limit for 300MB which have been working well for two months, and all of a sudden we saw spikes in CPU usage and response times (up to 39 seconds).
This web application handles roughly 1k requests per minute, so that is very low compared to what ASP.NET Core is benchmarked against. On the other hand, it's a web application that is very dependent on other API's as it doesn't have it's own storage, so one request in results in 1-5 different outgoing dependency calls to other API's. This means that for this web application to have a good throughput we cannot queue up too many dependency calls. This lead me into reading about the ThreadPool, because it is related to how many requests you can handle. It also lead me into reading about the ServicePointManager, because one of all things it control is the number of concurrent outgoing dependency calls you can make.
Another metric we noticed during our spike window was that the memory for the pods shut through the roof. We had to restart the pods in order for the memory to go back to normal. So it felt like we really had some memory troubles in our code. This lead me into removing all in-memory caches (I knew we had some) and reading about how the Garbage Collection (GC) works.
There's a lot of different things of course that affects the amount of memory your application uses, and I wasn't sure what was reasonable. The threshold of 300MB wasn't even set by our team either, so we had to investigate what memory limit is reasonable for a ASP.NET Core 3.1 application and what people "normally" use in k8s. (It's worth to mention that "normal" is maybe not fair to say considering that running ASP.NET Core inside k8s and containers is something that have evolved very rapidly the last few years, so I personally think it will require a few more years to be fully "battle-tested" if you will.). This lead me to read about what limits are reasonable for an ASP.NET Core application.
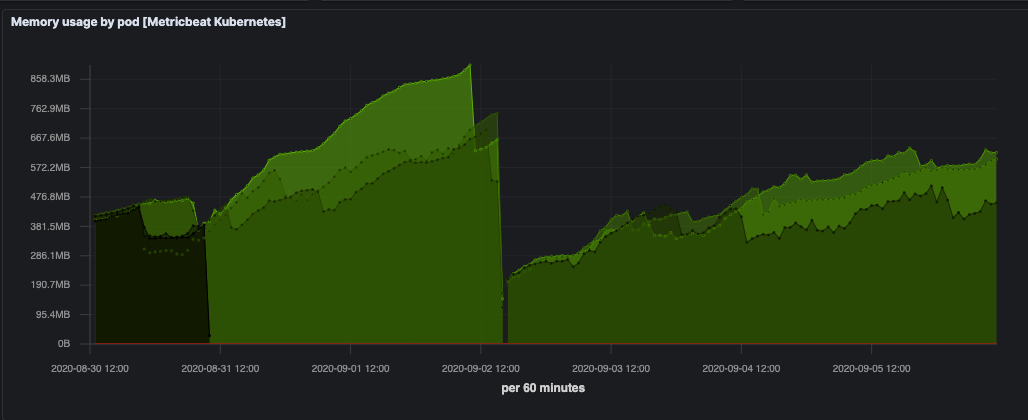
Unfortunately I don't have any graphs for when limit was 300MB. But below is with limit of 1GB. Also, the GC mode is workstation (will explain this later). Memory keeps going up as you can see.
Our goals
- Well performing ASP.NET Core 3.1 web application (around 200ms average response time for this particular application)
- Bursts of traffic handled well
- No spikes in CPU
- Memory usage more steadily - not constantly growing
First things first - improve the code
I did have a feeling that we were not going things right in our code, so I started to search for "pitfalls".
I did not have metrics for everything here, but I tried one thing after another - inspecting that the application behaved good/better and continued. Unfortunately I don't have updated graphs in-between each step I took.
- We did use in-memory caches. Also, we did use in-memory caches quite bad. Some things were left-over refactoring from moving into k8s. I thought this could be a reason why we had such a high memory usage. Do you have them? Might want to put this in external cache instead. Remember that k8s and containers is a very resource limited environment since a lot of containers are running there and they share physical memory and CPU. I moved all our in-memory cache to Azure Redis Cache. Now I hoped memory would look "better".
- No use of
.Result. No unnecessaryTask.Run. I also knew we had some very strange (bad) usage of async/await code, but I hadn't had time to fix it. I actually found a.Resultas part of a call in our login code. Imagine that. Every login causes the thread to lock. Not very good for scale. So now was the time to fix it.
Make sure your async/await code is looking right. If you code async/await wrong your app will most likely suck no matter what. - Some services which were supposed to be singletons were scoped, so I fixed this too. Be careful how you configure your dependency injection (DI) container. Make sure scoped services are scoped and singletons are singletons. Otherwise unnecessary objects might be created as your traffic increases. I wasn't sure how much impact this would have. Of course at a first glance this might sound very bad, but I was pretty confident the app still did "the right thing", I just wanted to use the right lifetime for each service.
.NET Core runtime
These things are essential to know when trying to understand memory usage and "wellbeing" of you application, so I thought i'll mention them. These are all decisions that the runtime will take no matter what; and to improve them we must first understand them.
- When k8s starts your container it will give it some CPU and memory limits (k8s tells Docker which tells your application). These matters more than you might think. The GC in .NET Core works differently depending on CPU and memory limits.
- There are two GC modes, "Workstation mode" and "Server mode". Server mode is the default for ASP.NET and assumes your process is the most demanding one running on the machine (which clearly isn't a good assumption in k8s, there can be hundreds on containers running). Server mode values CPU very high but assumes there's lot of RAM for the process, so it allocates more memory and uses the CPU more sparingly (which isn't a good approach in k8s, since RAM memory is very limited if you have hundres on containers running).
- .NET Core takes decisions depending on your OS. This means your Linux or Windows container in k8s. I've been using Linux containers. What docker tells your Linux container is then what the .NET Core runtime will read and take decisions on.
Environment.ProcessorCountis set by .NET Core depending on how much CPU docker gives you. CPU is specified in millicores, for example 300mi och 2500mi. It will truncate the value and that will be your number ofEnvironment.ProcessorCount. I will soon explain more details why this matters and what it affects. - If
Environment.ProcessorCount= 1 then Workstation mode is always used. You can also explicitly say you want Workstation mode by putting the following in .csproj<ServerGarbageCollection>false</ServerGarbageCollection>. For example in our app total memory was around 400MB in server mode and 200MB when I only added<ServerGarbageCollection>false</ServerGarbageCollection>to our app. There was no obvious changes to the performance however, so this is a bit mysterious what the proper value actually is to have. It seems that workstation mode might be the best in a resource-limited k8s environment. - As i've already said - the amount of memory the application uses depend on the GC mode, and the heapsize can be very small. The reason why I mention this is because I think it's worth to point out that they really are pushing .NET Core to work well with very little resources in case you're not sure if .NET Core is a good fit for k8s at all. I mean, 20MB is damn small:
Default GC heap size: maximum of20 MBor75%of the cgroup memory limit on the container
- Other code in .NET Core takes decisions depending on
Environment.ProcessorCount. For example the ConcurrentDictionary, HttpClient, the Garbage Collector (GC) etc as mentioned. - Threads are expensive, and the ThreadPool is good at handling lots of
Task's with a few threads. The ThreadPool therefore - when needed - gives you roughly 1 more thread each 0.5 seconds on demand. This is because the .NET Core runtime doesn't want to allocate hundred of threads just because of a traffic spike. It seems the ThreadPool is very efficient anyway, so you shouldn't need that many more threads to handle quite more traffic (as long as you're using async/away correct in your code of course!). Remember those.Resultnightmare-calls that blocks the thread. Don't use them. - If you usually have bursts of traffic at different times you might want to increase the miniumum amount of threads the ThreadPool can create on demand. By default the ThreadPool will only create
Environment.ProcessorCountnumber of threads on demand. Read more here. - You can call
ThreadPool.SetMinThreadsif you want to change the number of threads the runtime will create on demand. If you set it to 10 for example then those 0.5 seconds won't be considered during a spike. 10 threads will be created very fast without a doubt. Then the 0.5 seconds kicks in again giving you just 1 on demand. To increase the number of min threads could be beneficial to handle spikes, but i've found little evidence that suggests this is something everyone should do. Rather not. Officials docs says for example:
You can use the SetMinThreads method to increase the minimum number of threads. However, unnecessarily increasing these values can cause performance problems. If too many tasks start at the same time, all of them might appear to be slow. In most cases, the thread pool will perform better with its own algorithm for allocating threads.
Now i've gone through some detail regarding memory and ThreadPool. There's one more thing we had to look at in my case, since we made a lot external API calls (dependencies) and used the network a lot.
Network-intensive apps
If you're reading this post you most likely have read about the HttpClient, HttpClientFactory, whether you should reuse the HttpClient or not. HttpClient is the standard way to make API calls in .NET Core so most people are familiar with it.
What's far less obvious is that the HttpClient uses something called the ServicePointManager to handle requests. A ServicePoint is an external API, say https://google.com or https://blog.steadycoding.com. One ServicePoint is created per URI. And one of the ServicePoint responsibilities is to not nuke the external API. So even if you have thousands of incoming requests and make thousands of outgoing API calls concurrently, they won't actually be that concurrent, because the ServicePoint decides how many outgoing OS connections we're actually going to open, and this is 10 by default in ASP.NET Core apps (Not at all related to .NET Core itself - but to give you a better understanding - Chrome has a similar feature, so it seems this is something common).
So if your API makes a lot of calls to another API you might need to increase this default limit. I tried 50 for us and it works fine. You do this by calling ServicePointManager.DefaultConnectionLimit = 50;. You could set it to ServicePointManager.DefaultConnectionLimit = int.MaxValue too, but be careful so that you don't exhaust connections at the API your're calling.
Edit 2022-03-13: I was actually wrong when first writing this post regarding the usage of ServicePointManager and mixed up .NET Framework vs .NET Core. When using a HttpClient in the .NET Framework, then the HttpClient uses HttpWebRequest which in turn uses the ServicePointManager. In .NET Core (I think it is 2.1 and later) however, HttpClient uses a HttpClientHandler which is rewritten and does not use the ServicePointManager. Even though HttpWebRequest and ServicePointManager exists in .NET Core, they are not used by the HttpClient, and hence that was wrong in my original version of this post. In .NET Core you can change the corresponding value by HttpClientHandler.MaxConnectionsPerServer. I'll keep the original post as-is still, because I realize these details can be a bit different depending on which .NET Core version you run. So please keep that in mind. The key take-away still is that you can control the number of allowed outgoing connections.
It's hard to know what's best
So, it's easy to find information about similar problems but it's very hard to find a single "right" configuration for all these values. Really you'll have to try what works best for you. One thing is for sure however - do look through all your code and search for .Result and Task.Run for example. Refactor all this code to work better with async/await. Also remove all your in-memory caches because (1) they eat memory, even in low-resource environments such as k8s and (2) in-memory cache must have it's own cache per pod of course, which kinda destroys the purpose of a cache.
Assuming your code looks good
- Try use
<ServerGarbageCollection>false</ServerGarbageCollection>. This will make your app use Workstation GC. Seems like Workstation GC might actually perform better in low-resource environments such as k8s. - Remember you can always scale horizontally by increasing the number of replicas (pods) to handle more traffic. (Even if you don't change the
ServicePointManager.DefaultConnectionLimit, each pod will by default of course get it's own limit, so scaling in this sense is the same as increasingServicePointManager.DefaultConnectionLimitfor just a single pod). - Carefully: Slightly try increase
ThreadPool.SetMinThreadsif you feel. This might help a bit for spikes. But remember what the official docs said. Personally why I hate this type of code is because other developers over time will most likely never dare to change these values. Just imagine the discussions:
Person A: Why do we increase the min threads on the ThreadPool?
Person B: I'm not exactly sure, but let it be there, it works.
Summary
There's a lot of things to pay attention to here. I do believe there are some practises that are generally more accepted (such as making sure your code looks good first of all), but it's really hard to know the "best" configuration values for the rest. In the end it depends on what kind of API you have. Some API's are very dependent on other API's and some are very CPU intense. They all behave slightly different and I think this is why it's hard to find a single "best" configuration for the ThreadPool for example.
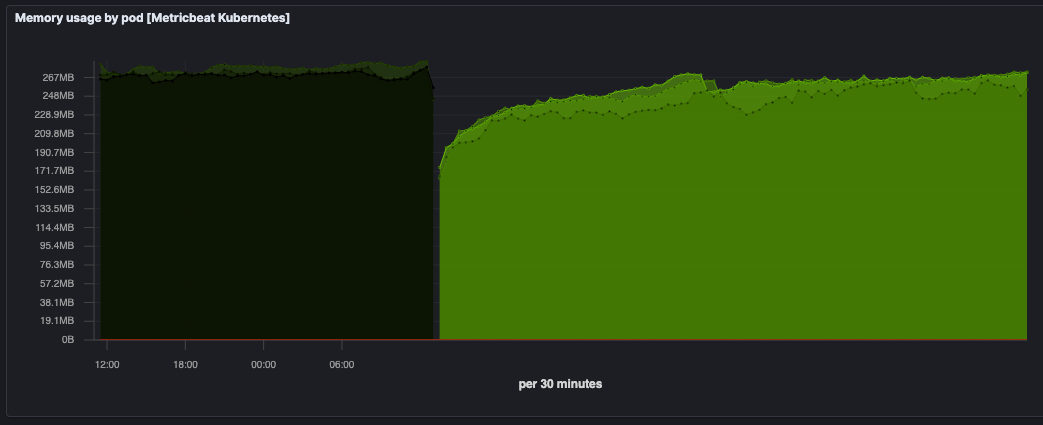
This is what our memory usage looks like now with GC set to Workstation mode, in-memory caches removed and the default connection limit set to 50. (compare this to climbing towards 800MB in graph 2):
And this is the request duration and count:
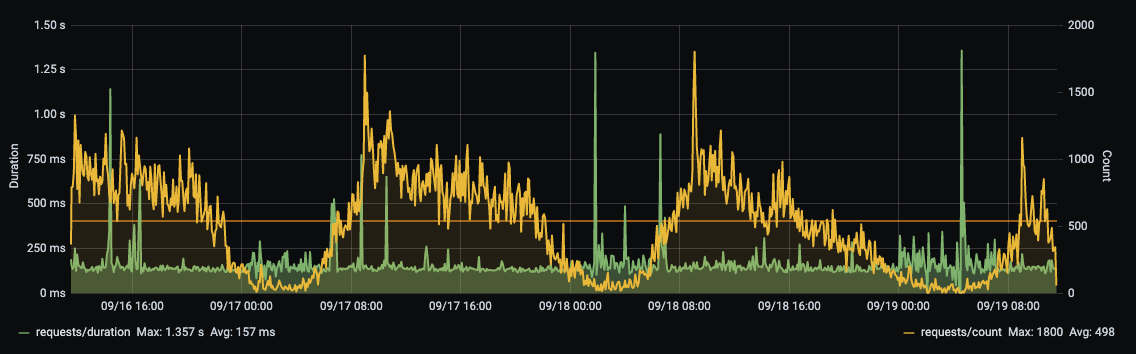
We can see see that memory usage is now much better and well-suited to fit into k8s. Also, our response times haven't gotten any spikes, and we actually have lowered our overall average response time by around 70MS (now average is 157MS, previously it were around 230MS. Much likely because I increased the number of outgoing concurrent calls).
Hope you learned something from this post and know where to start looking for optimizations.
Further reading:
- Troubleshooting high memory usage with ASP.NET Core on Kubernetes
- Optimizations when Environment.ProcessorCount > 1 in Kubernetes environment
- .NET Threadpool starvation, and how queuing makes it worse
- HTTPCLIENT CONNECTION POOLING IN .NET CORE
- Reusing HttpClient didn’t solve all my problems
- Controlling the Number of Outgoing Connections From HttpClient (.Net Core or Full Framework)